Generating Widgets
Widgets are the way to visualize your data in the dashboards. Widgets display your data or information in a selected format that you can configure through the Widget Generation Wizard.
Prerequisites
The following prerequisites are required only in the following scenarios:
- The data provider selected is RDBMS Batch Data Provider or RDBMS Streaming Data Provider.
- If the data provider used is Siddhi Store Data Provider and the Siddhi application makes a reference to the data source defined in the
deployment.yamlfile.
Before generating widgets, the following prerequisites must be completed:
A data source must be configured for the widget. Data sources are configured in the
<SP_HOME>/conf/dashboard/deployment.yamlfile. The following is a sample H2 data source.- name: SAMPLE_DB description: Sample datasource used for gadgets generation wizard jndiConfig: name: jdbc/SAMPLE_DB useJndiReference: true definition: type: RDBMS configuration: jdbcUrl: 'jdbc:h2:${sys:carbon.home}/wso2/${sys:wso2.runtime}/database/SAMPLE_DB;IFEXISTS=TRUE;DB_CLOSE_ON_EXIT=FALSE;LOCK_TIMEOUT=60000;MVCC=TRUE' username: wso2carbon password: wso2carbon driverClassName: org.h2.Driver maxPoolSize: 50 idleTimeout: 60000 connectionTestQuery: SELECT 1 validationTimeout: 30000 isAutoCommit: falseDownload the required JDBC driver (i.e., based on the database type you are using) and copy it to the
<SP_HOME>/libdirectory.This driver must be OSGI compatible in order to be detected.
Generating a widget
To generate create a widget and display it in a dashboard, follow the steps below:
- Start and access the WSO2 SP Dashboard Portal. For detailed instructions, see Visualizing Data.
- Click +.

Then click Create Widget to open the Create Widget wizard.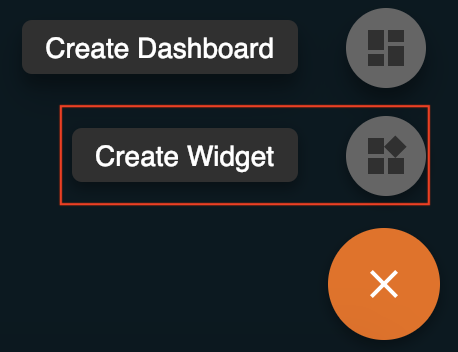
- In the first page, enter a name for the new widget. In this example, let's enter
Transactionsas the name.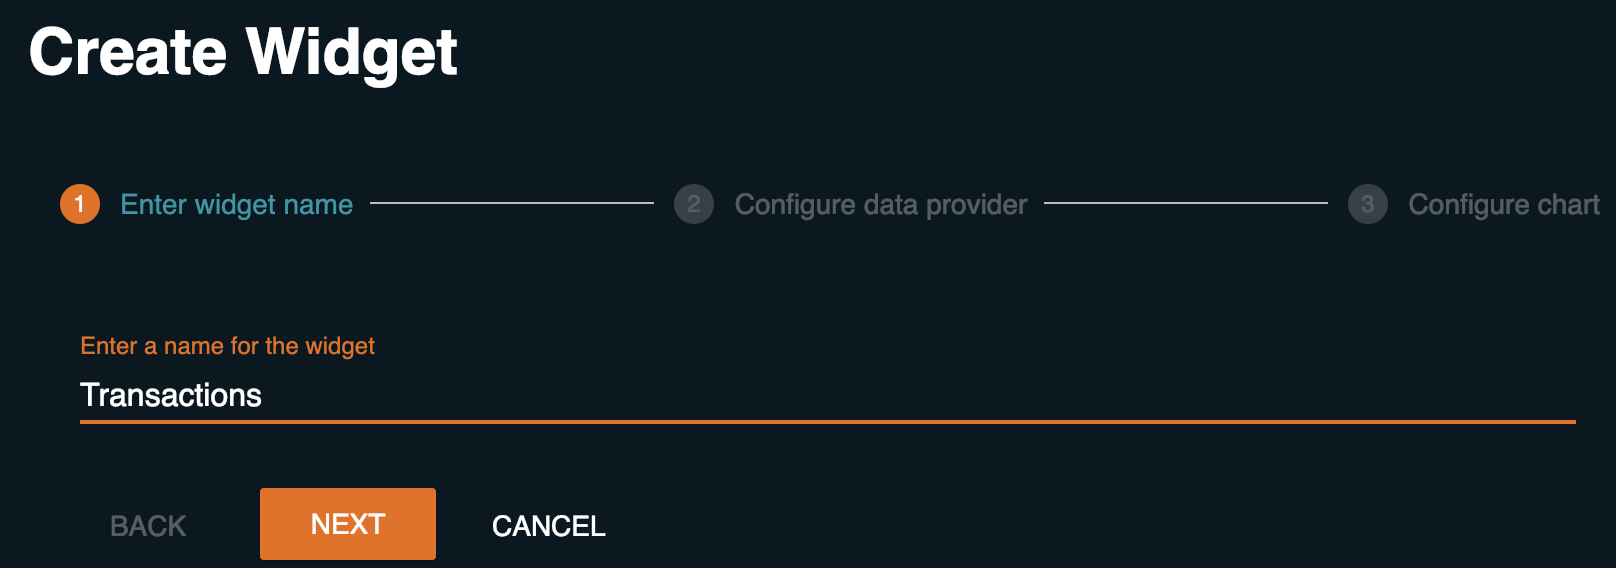
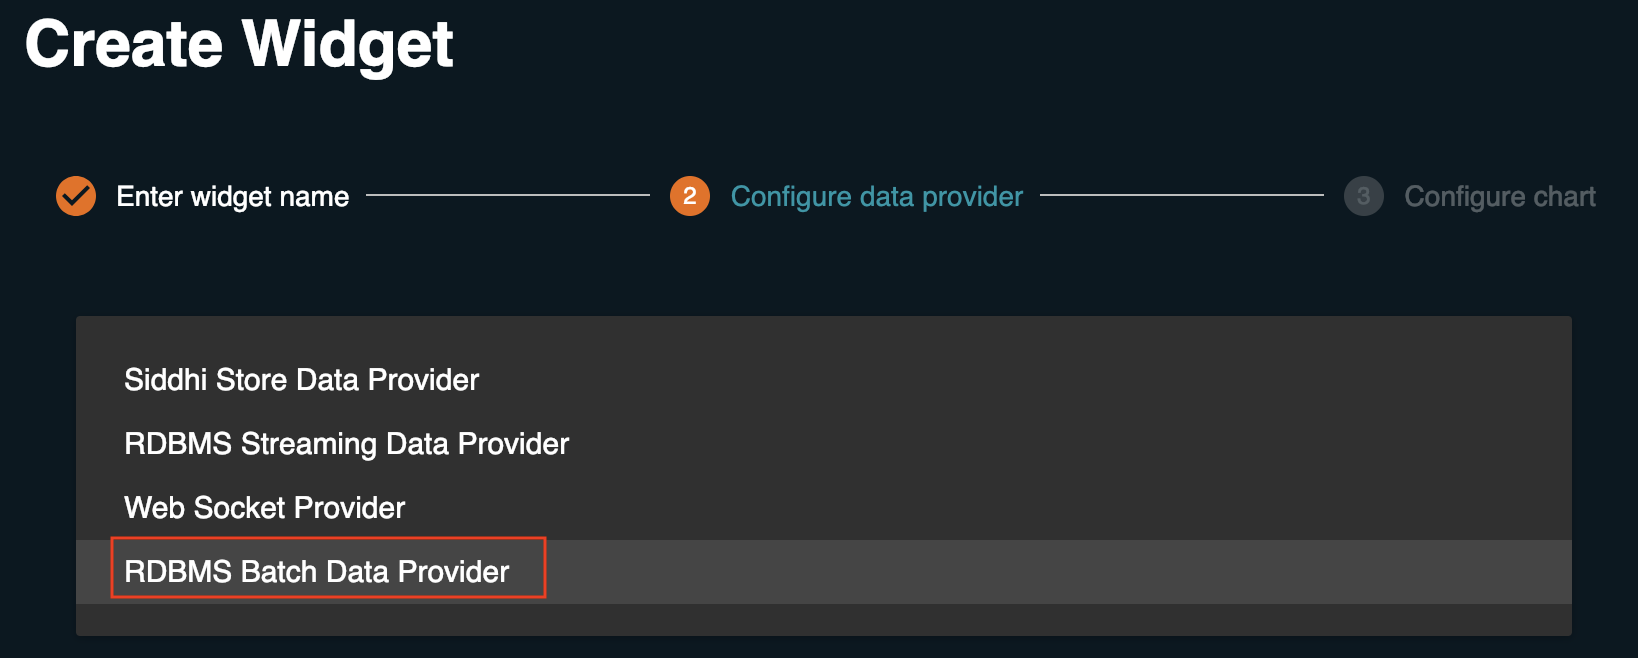
Click Next. Then select a data provider for the widget. The data provider is the source from which the widget extracts information to be displayed. In this example, let's select RDBMS Batch Data Provider as the data provider.
As a result, the page is populated with the default configurations of theSample_DB datasource. Click Next to proceed.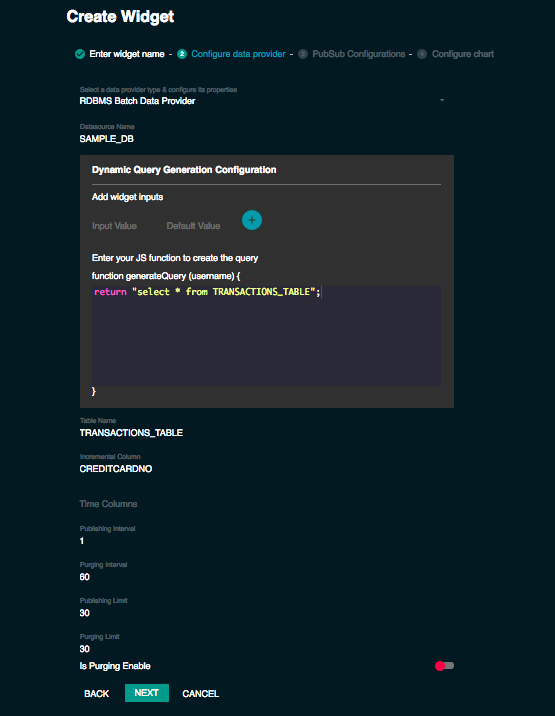
The parameters you need to configure vary depending in the data provider you select. The following are the parameters you need to configure for the other available data providers.
The parameters available to be configured for these data providers depend on how the data providers are configured via WebSocket messages. For more information, see Working with Data Providers.
Siddhi Store Data Provider
Parameter Name Description Example Siddhi App The Siddhi application that stores the data to be visualized in the Siddhi store.
Only the siddhi event table/ aggregation definition needs to be added here, with applicable annotations (@store, @PrimaryKey) (Note: For aggregation, aggregation input stream should also be defined)
define stream MasterpassTransactionDataStream (merchant_client_id string, merchant_name string, checkout_transaction_id string, card_brand_id string, card_brand_name string,card_bin long,card_holder_name string, card_expiry_mm int,card_expiry_yy int,card_aav int,card_sli int,card_billing_address1 string,card_billing_address2 string,card_billing_city string,card_billing_subdivision string,card_billing_postal string,card_billing_country string,contact_email string,contact_firstname string,contact_lastname string,contact_nationalid long,contact_gender string,contact_dob_mm int,contact_dob_yyyy int,contact_address1 string,contact_address2 string,contact_city string,contact_subdivision string,contact_country string,contact_postal string,shipping_address1 string,shipping_address2 string,shipping_city string,shipping_subdivision string,shipping_country string,shipping_postal string,shipping_recipient_name string,wallet_id int,region string,total_usd float);

@store(type='rdbms', jdbc.url="jdbc:mysql://localhost:3306/MasterCardDB", username="root", password="root" , jdbc.driver.name="com.mysql.jdbc.Driver")
                define aggregation MasterpassTransactionDataStreamByCardType
                from MasterpassTransactionDataStream
                select card_brand_name, region, sum(total_usd) as totalAmount
                group by card_brand_name,region
                aggregate every minutes ...year;
Dynamic Query Generation Configuration
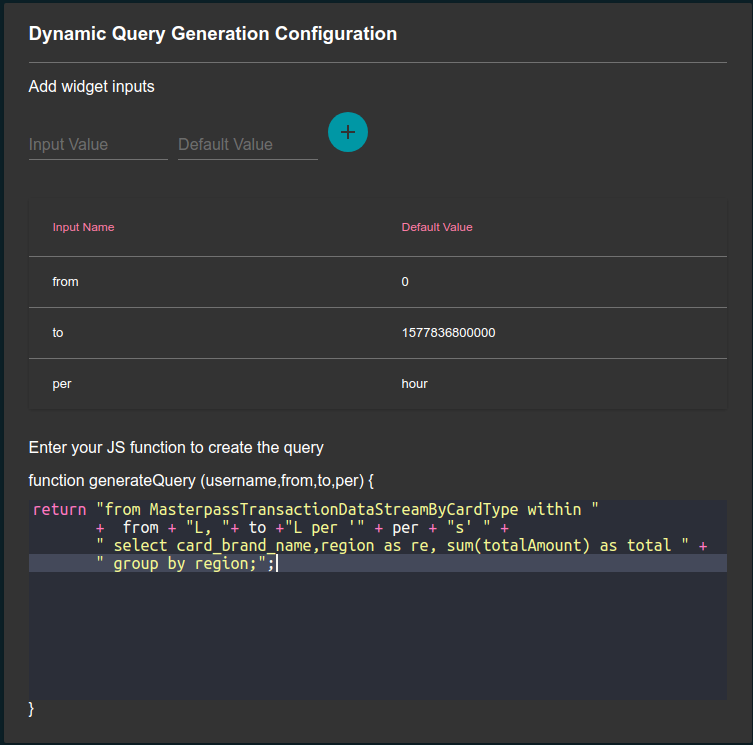
The javascript function which returns the query that the data provider needs to execute in order to get the required information from the database. This can be provided in two ways:Static query: This involves providing a simple query without using any external values. Here, you do not need to enter widget inputs.
e.g.from MasterpassTransactionDataStreamByCardType within'2018-**-** **:**:**'per'hours'select card_brand_name,region as re, sum(totalAmount) as total group by regionDynamic query(with widget inputs): This involves adding external inputs received from publisher widgets under Add widget inputs. You can click + to add more inputs. You need to specify the default values to be used in the query if no input is received from publisher widgets.
e.g.return"from MasterpassTransactionDataStreamByCardType within "+ from +"L, "+ to +"L per '"+ per +"s' select card_brand_name,region as re, sum(totalAmount) as total group by region";
This configuration is done only if the widget you are creating is a subscriber widget that uses the output of another widget as an input. For more information, see Inter Widget Communication via the PubSub Model.
return "from MasterpassTransactionDataStreamByCardType within " + from + "L, "+ to +"L per '" + per + "s' select card_brand_name,region as re, sum(totalAmount) as total group by region";
Publishing Interval The frequency with which you want the data provider to poll data from the Siddhi store. The time interval is specified in seconds. 5Websocket Provider
Parameter Name Description Example Map Type The map type to convert the data received via WebSocket in order to update them in the widget. Supported mapping types are, xmljsonandtext.xmlTopic The WebSocket topic to which WSO2 SP needs to listen in order to display information in the widget topic1Metadata related to the stream The metadata related to the stream. The attributes of the stream into which the events published in the widget are received can be added here. The fields in the table is as follows: Metadata Name: The name of the stream attribute.
Metadata Type: The metadata type of the attribute. This can be one of the following.
- Linear: Data is received in numerical format.
- Ordinal: Data is received in string format.
- Time: data is received as timestamps.
The definition of the stream from which events published in the widget are fetched is as follows:
define stream SweetTotalStream(namestring, totalProduction long);This can be entered as metadata as shown below: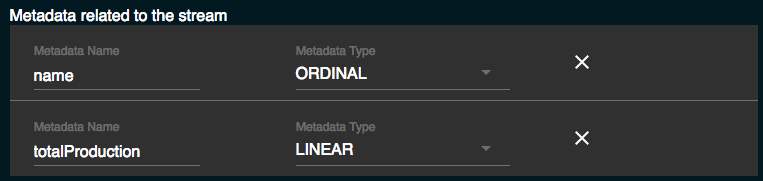
RDBMS Streaming Data Provider
Parameter Name Description Example Datasource Name The name of the data source from which the widget extracts information to be displayed. SAMPLE_DBDynamic Query Generation Configuration
The javascript function which returns the query that the data provider needs to execute in order to get the required information from the database. This can be provided in two ways:Static query: This involves providing a simple query without using any external values. Here, you do not need to enter widget inputs.
Dynamic query(with widget inputs): This involves adding external inputs received from publisher widgets under Add widget inputs. You can click + to add more inputs. You need to specify the default values to be used in the query if no input is received from publisher widgets.
This configuration is done only if the widget you are creating is a subscriber widget that uses the output of another widget as an input. For more information, see Inter-widget Communication via the Publisher/Subscriber Model.
Entering a query: return "select * from TRANSACTIONS_TABLE";Adding widget inputs:
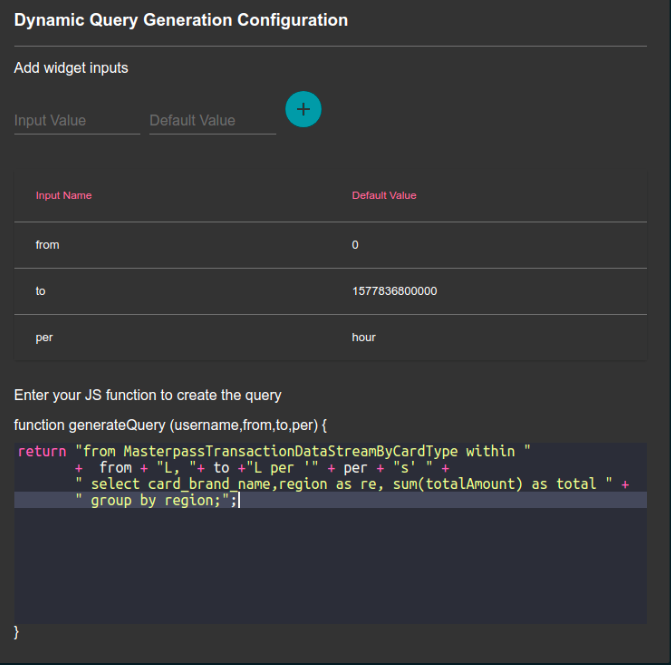
Table Name The name of the table from which the data provider must poll data. TRANSACTIONS_TABLEIncremental Column A data column that is used by the data provider to identify new records. CREDITCARDNOTime Columns Columns in the Table that contain time data, separated by commas. timeFieldOne,timeFieldTwoPublishing Interval The frequency with which you want the data provider to poll data from the database. The time interval is specified in seconds. 1Purging Interval The frequency with which you want the data provider to run purging queries on the database. The time interval is specified in seconds. 60Publishing Limit The number of records you want the data provider to publish at a time. 30
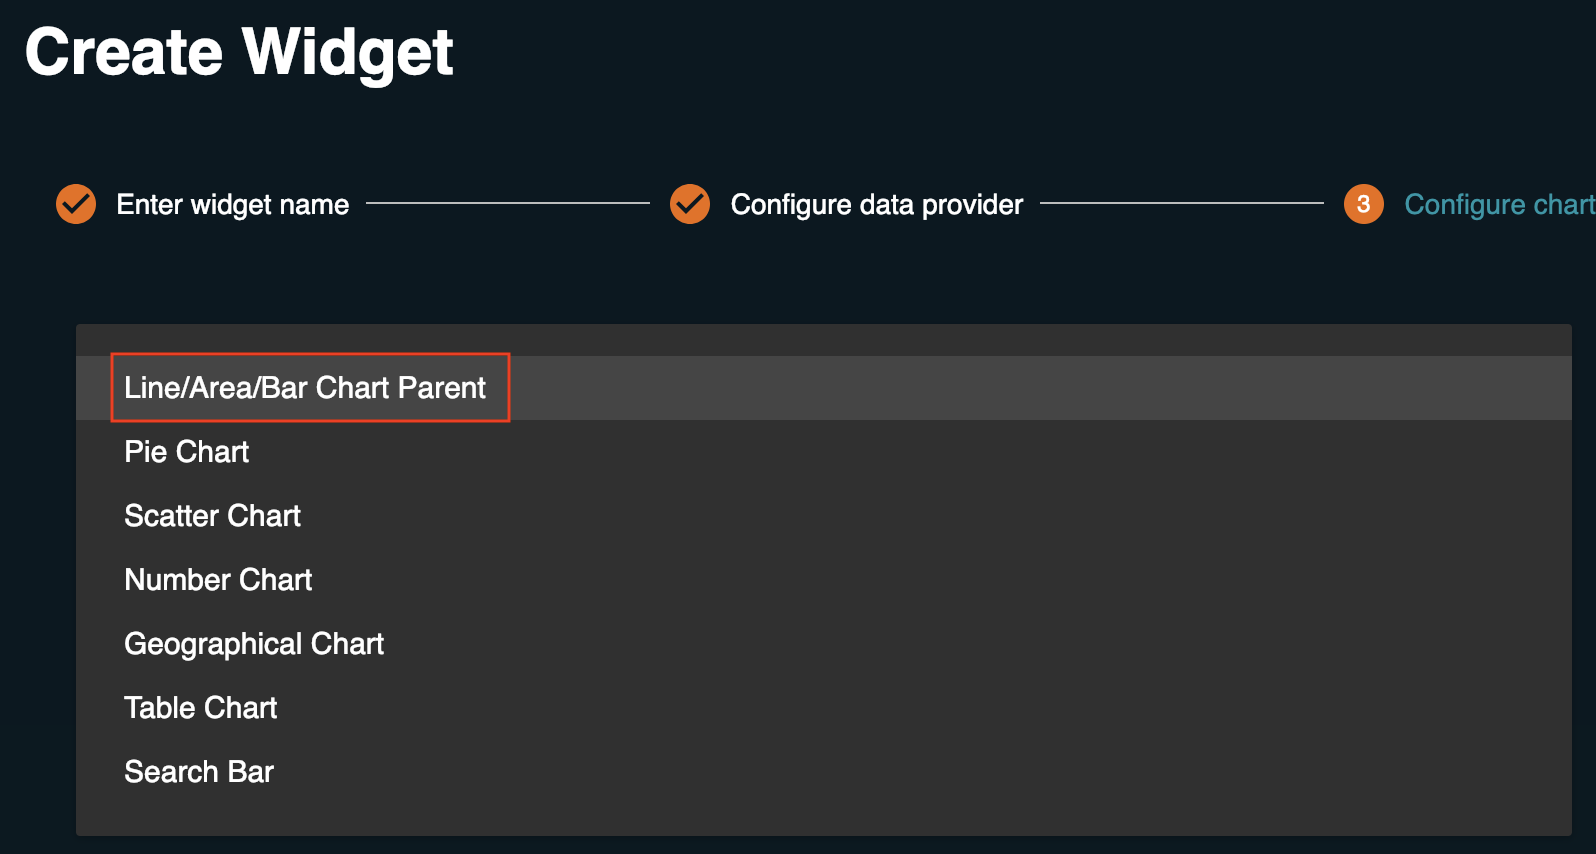
- Select a chart type of your choice. For this example, let's select Line/Area/Bar Chart Parent.
- Configure your chart as follows:
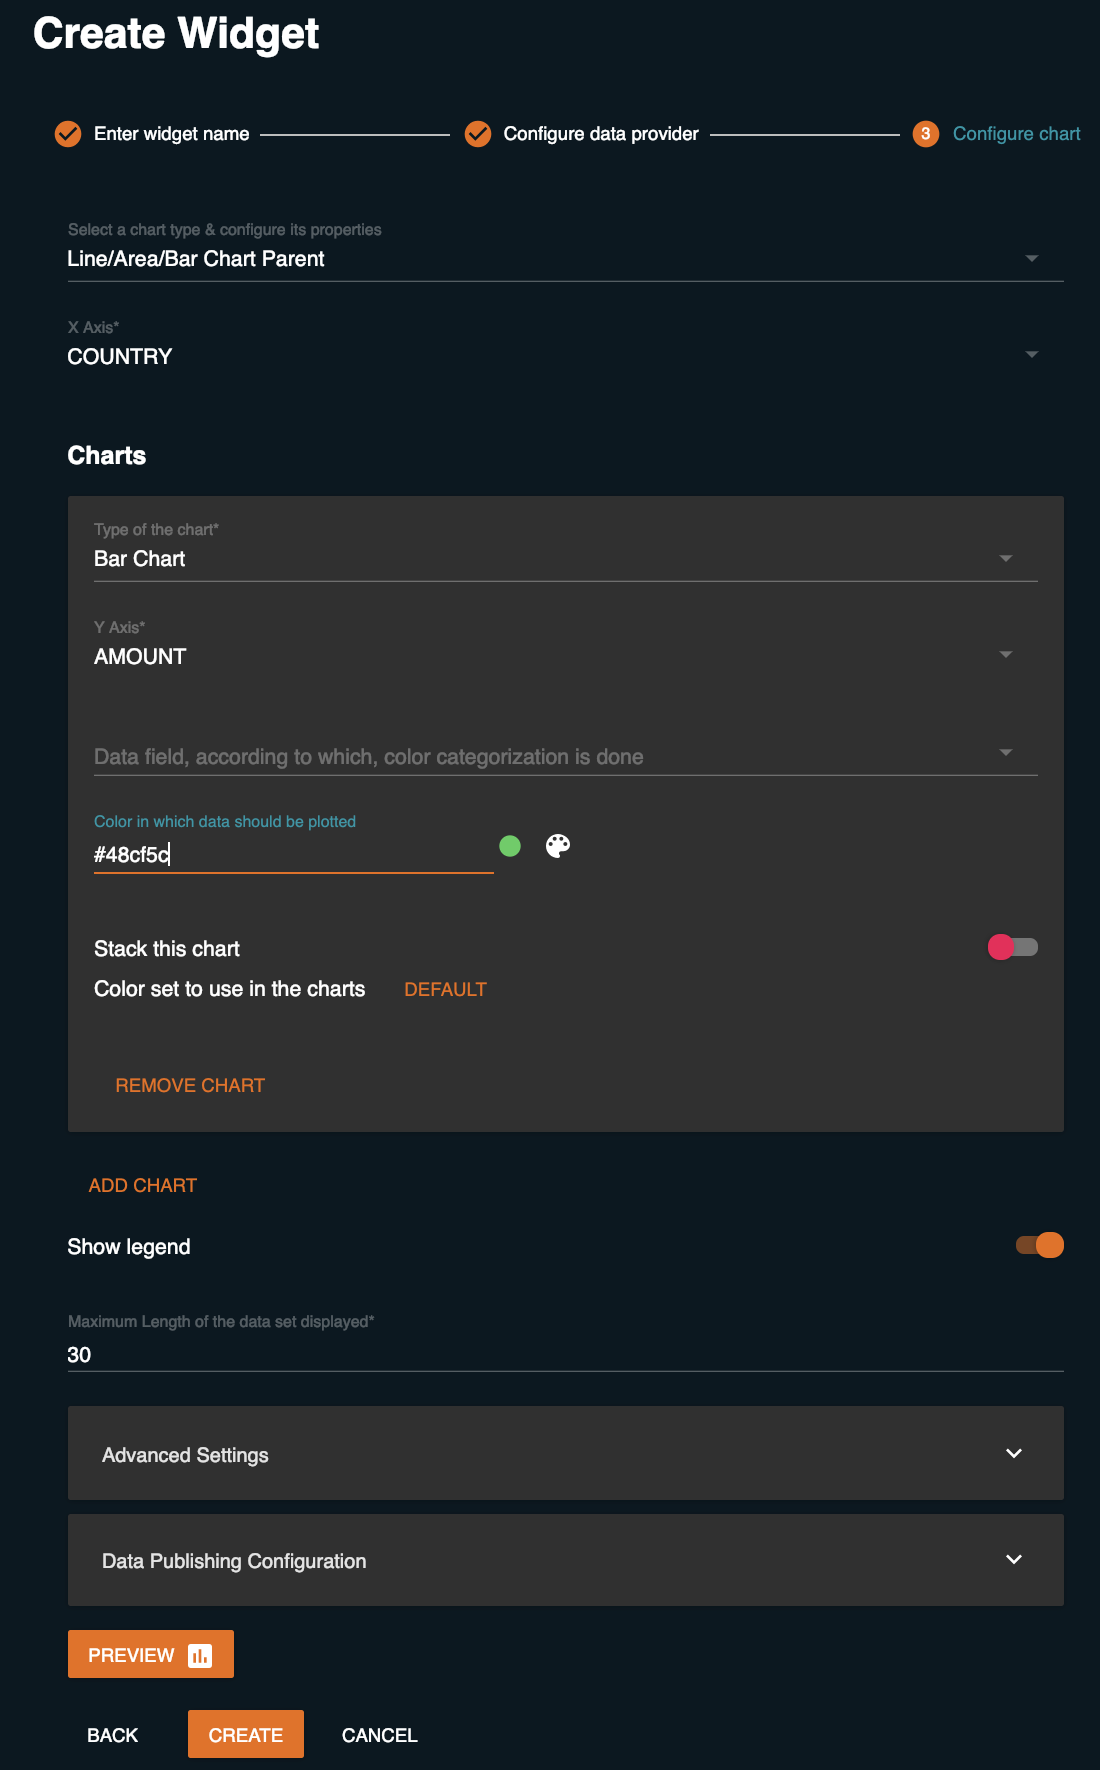
- Select the data fields that should represent the X and Y axes of your graph. In this example, let's select Country for the X axis and Amount for the Y axis.
- If you want to do a color categorization, select the field based on which you want it to be done.
- If you want to design another chart within the same graph, click Add Chart and configure that chart as required.
- If you want to do any advance configurations, expand the Advanced Settings section and do the required configurations. For more information about the advanced settings you can configure, see Customizing charts.
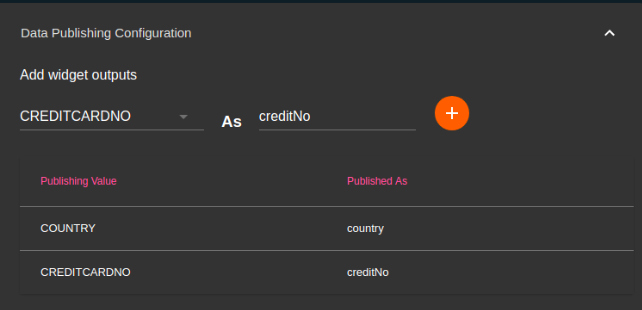
If the chart is a publisher widget, expand the Data Publishing Configuration section. Then specify how the widget outputs need to be displayed by entering the required text as shown in the example below. To add a new widget output, you can click +.
This configuration is done only if the widget is a publisher (i.e., it's output is used by one or more other widgets as input). For more information, see Inter-widget Communication via the Publisher/Subscriber Model .
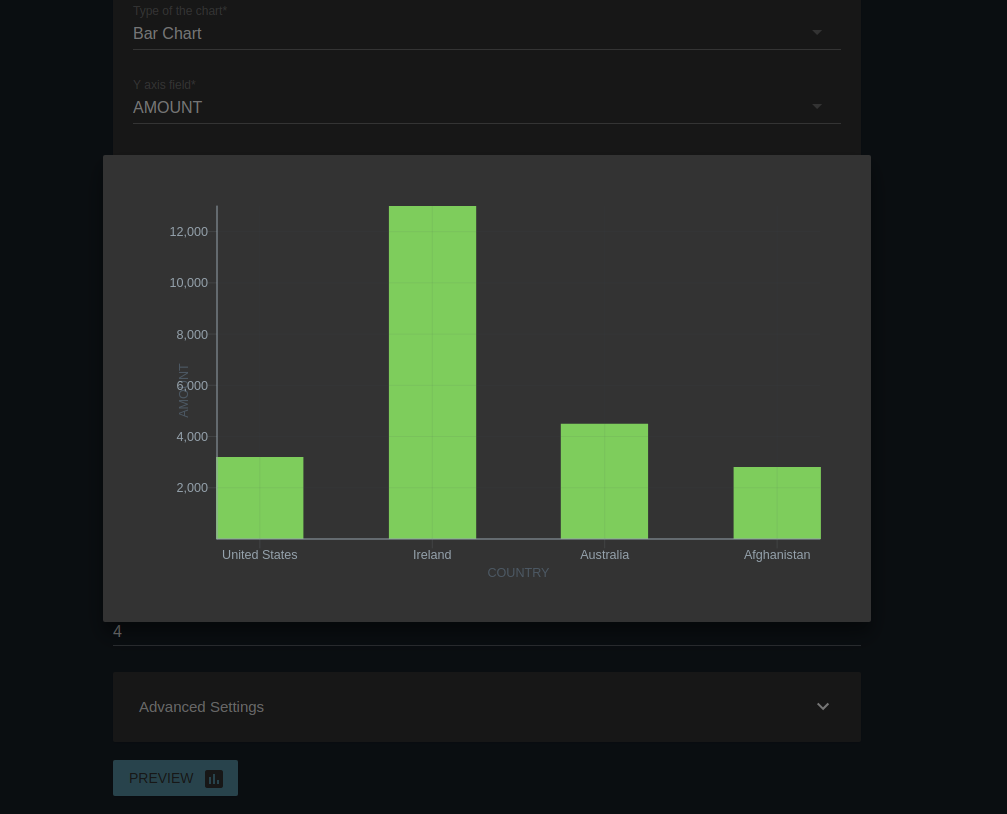
- Once you have configured your chart(s) as required, click Preview to see how it will look when it is added. In this example, the widget configured looks as follows.
- To save the widget, click Create. A message appears to inform you that the widget is successfully created. Now this widget can be used in any dashboard. Once you click Create you are also redirected to the landing page.
- Open the Dashboard Designer wizard for an existing dashboard (for detailed instructions, see Editing Dashboards). Then click on the required page.
- Click Widgets.

This opens the Widget Store as shown below.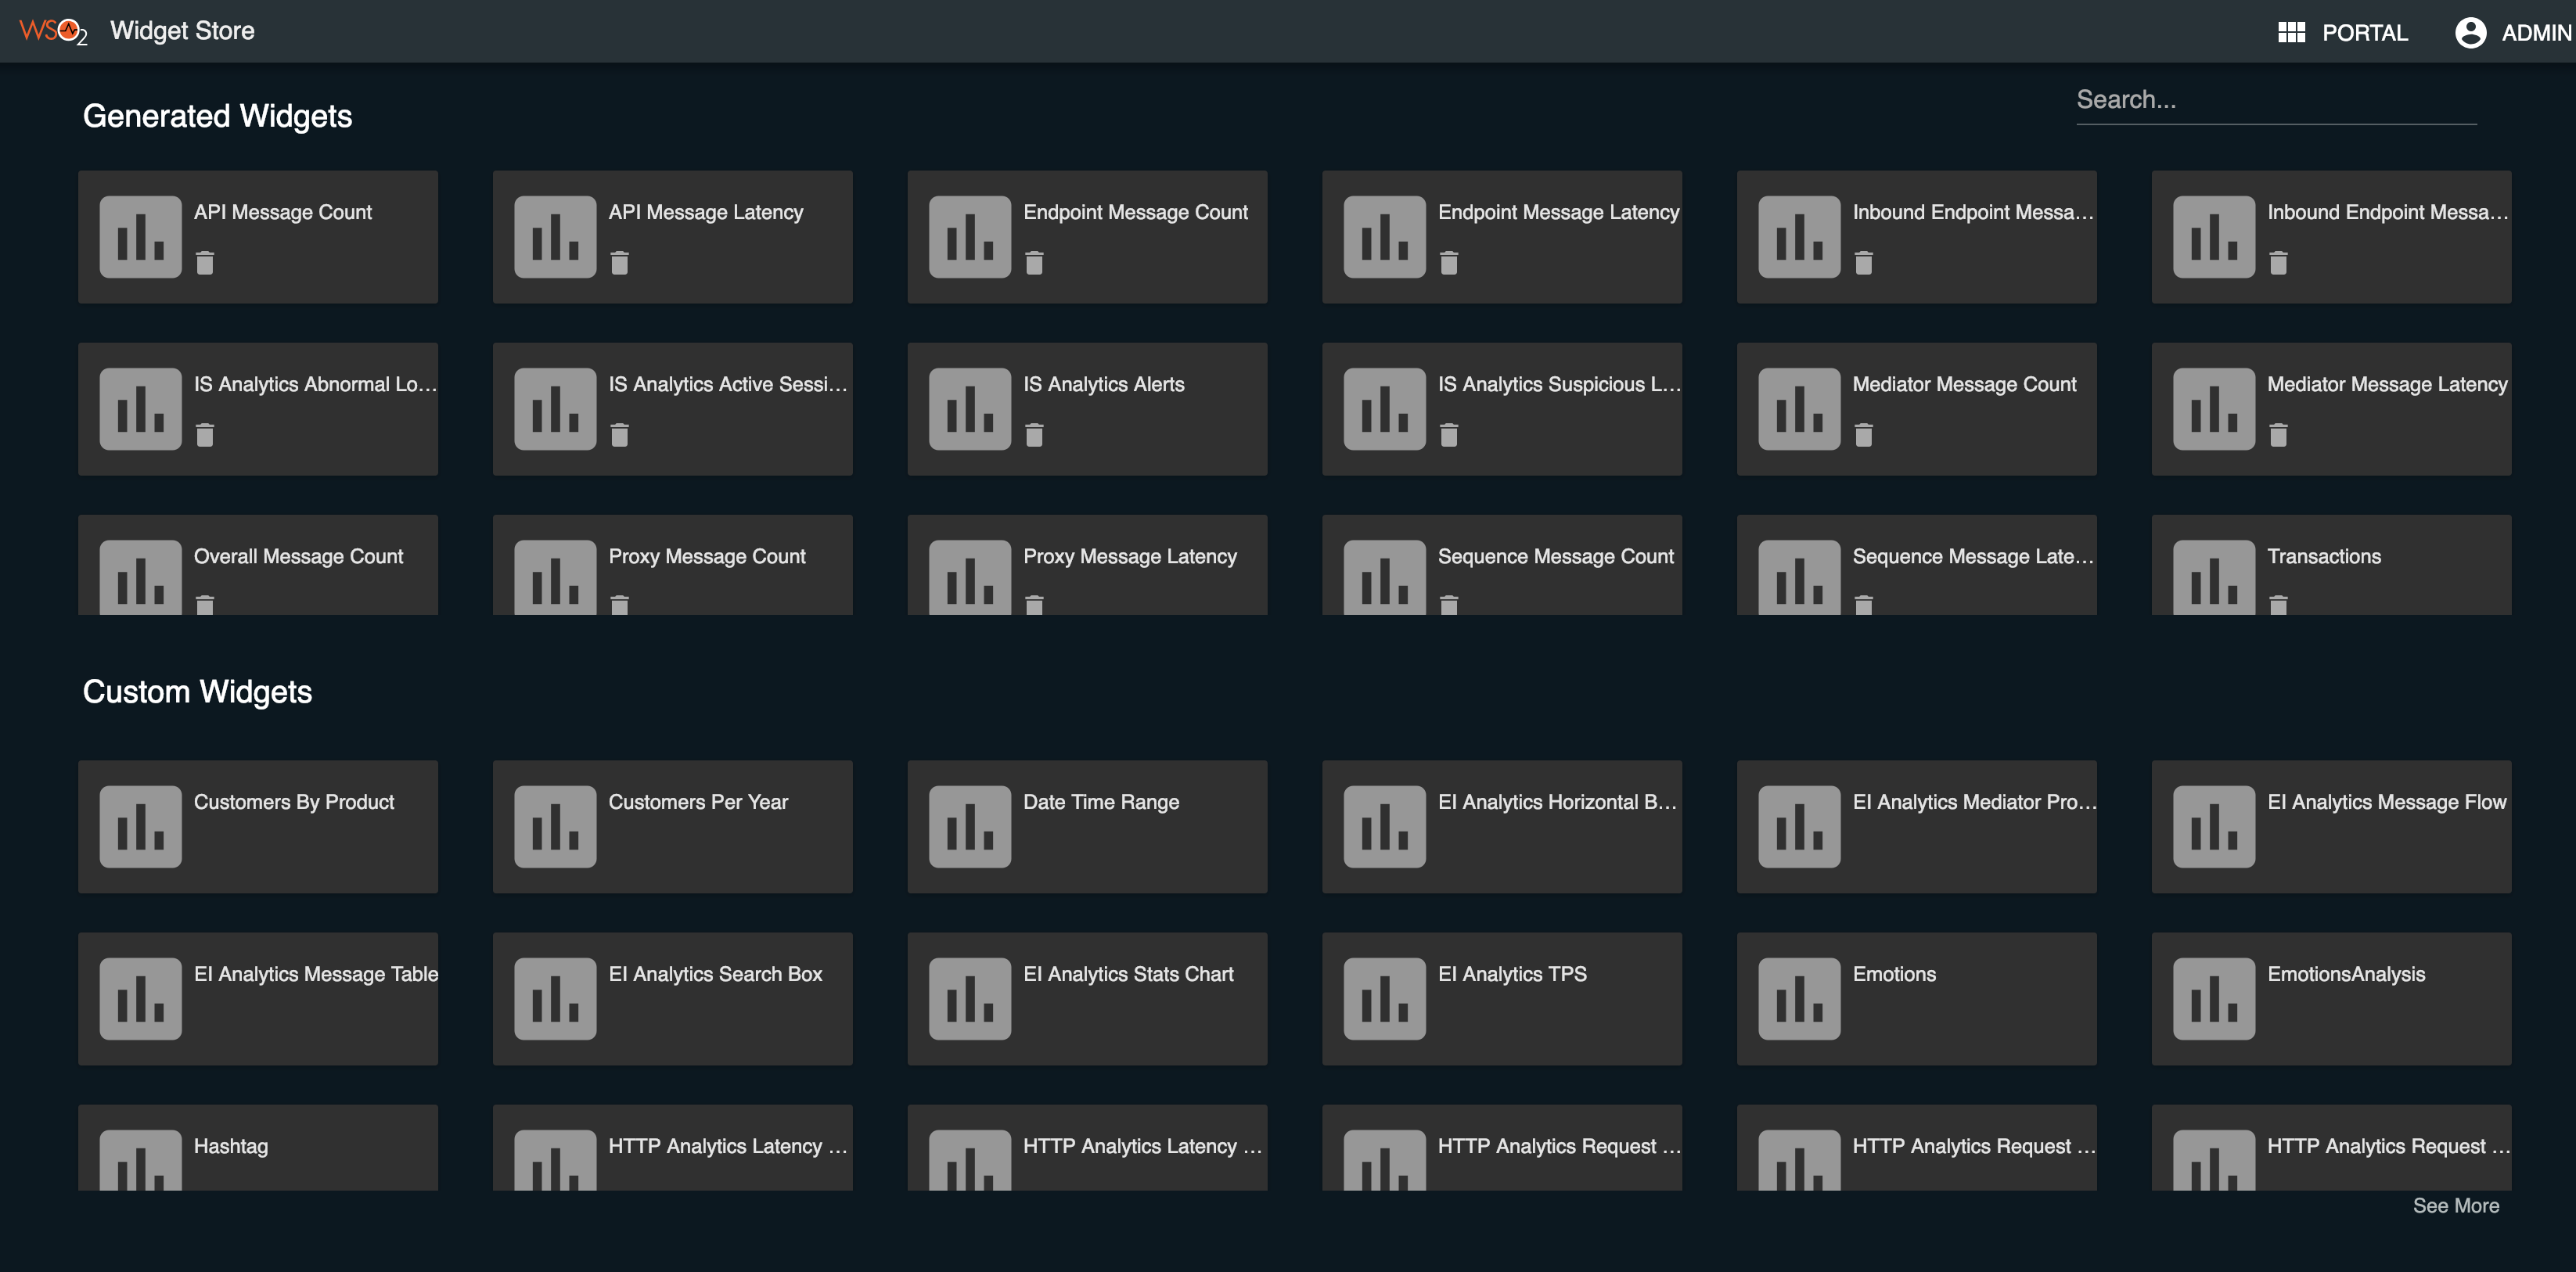
The Transactions widget you created is displayed under Generated Widgets.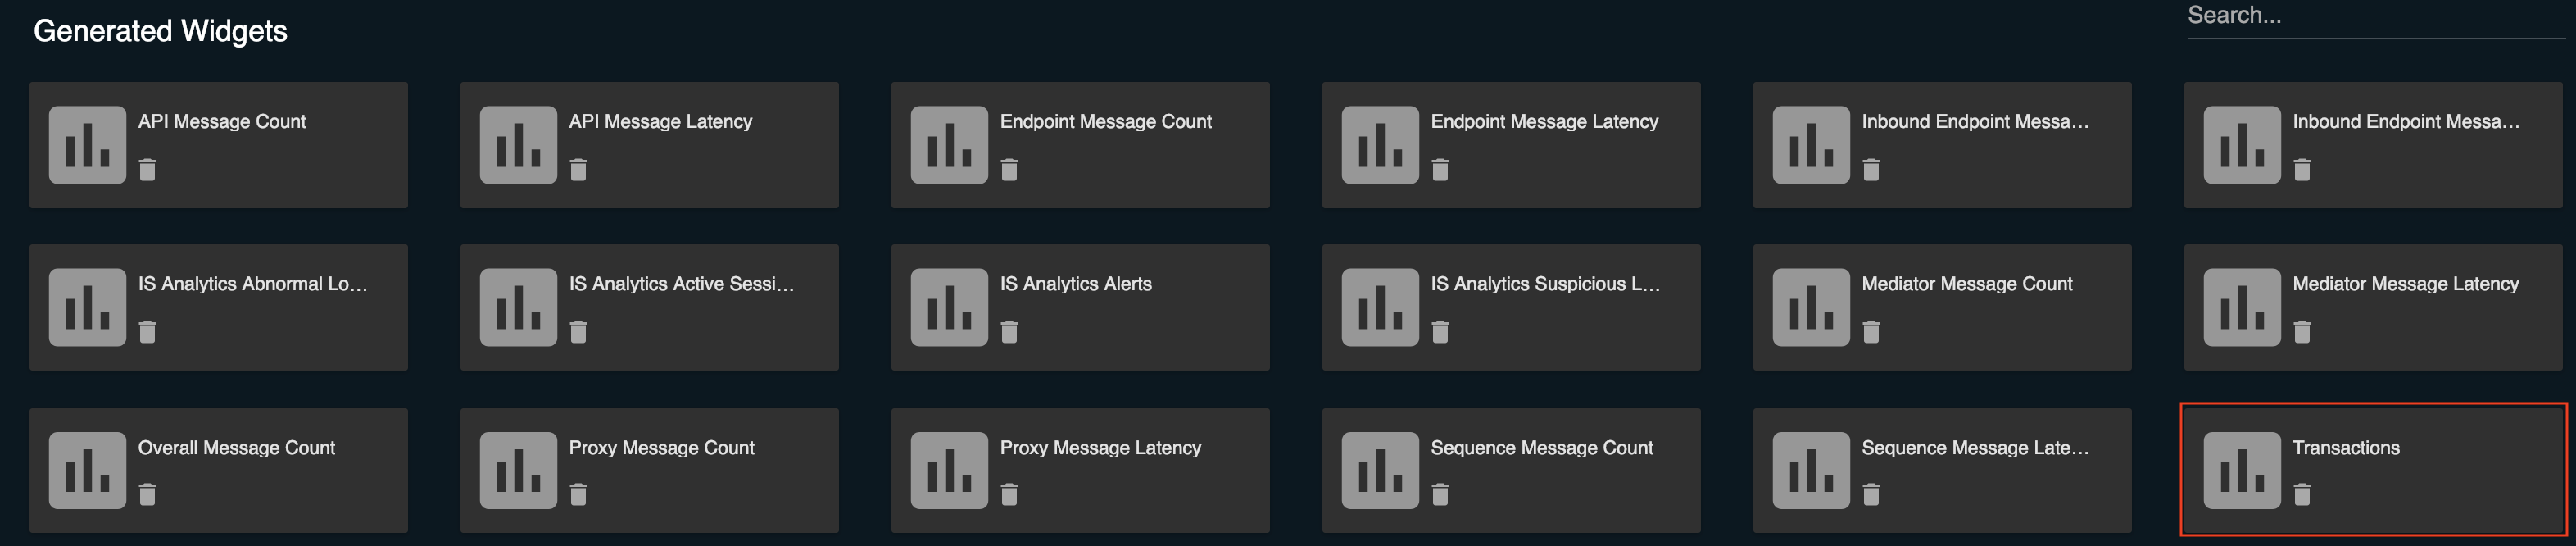
Customizing charts
The following are advanced settings that you can use when you configure widgets.
Time formatting regex: The charts in WSO2 SP Dashboard Portal handle time series data automatically and format them accordingly. However, if you want to customize how they are formatted, you can specify the required time format in a regex format as explained in d3 documentation .
Tick axis angles: If you want to rotate the ticks of an axis,you can specify the amount (in degrees) as a numerical value.
Maximum length of the dataset: This property can be used if you want to limit the number of data points that are visible in a given chart at a time.
Add Chart (when generating Line/ Area/ Bar charts): This can be used if you want to draw another line, area or bar chart on the same XY plane using the same data set. Properties to configure another chart are provided in the form.
Color set to use in the charts: Charts are shipped with a default color set that is used to visualize the data. If you want to override this color set, you can define your own color set by using this option. You can define a list of colors in hex format that can be used in the charts.